Market Weather Grid
Loading the sector board…
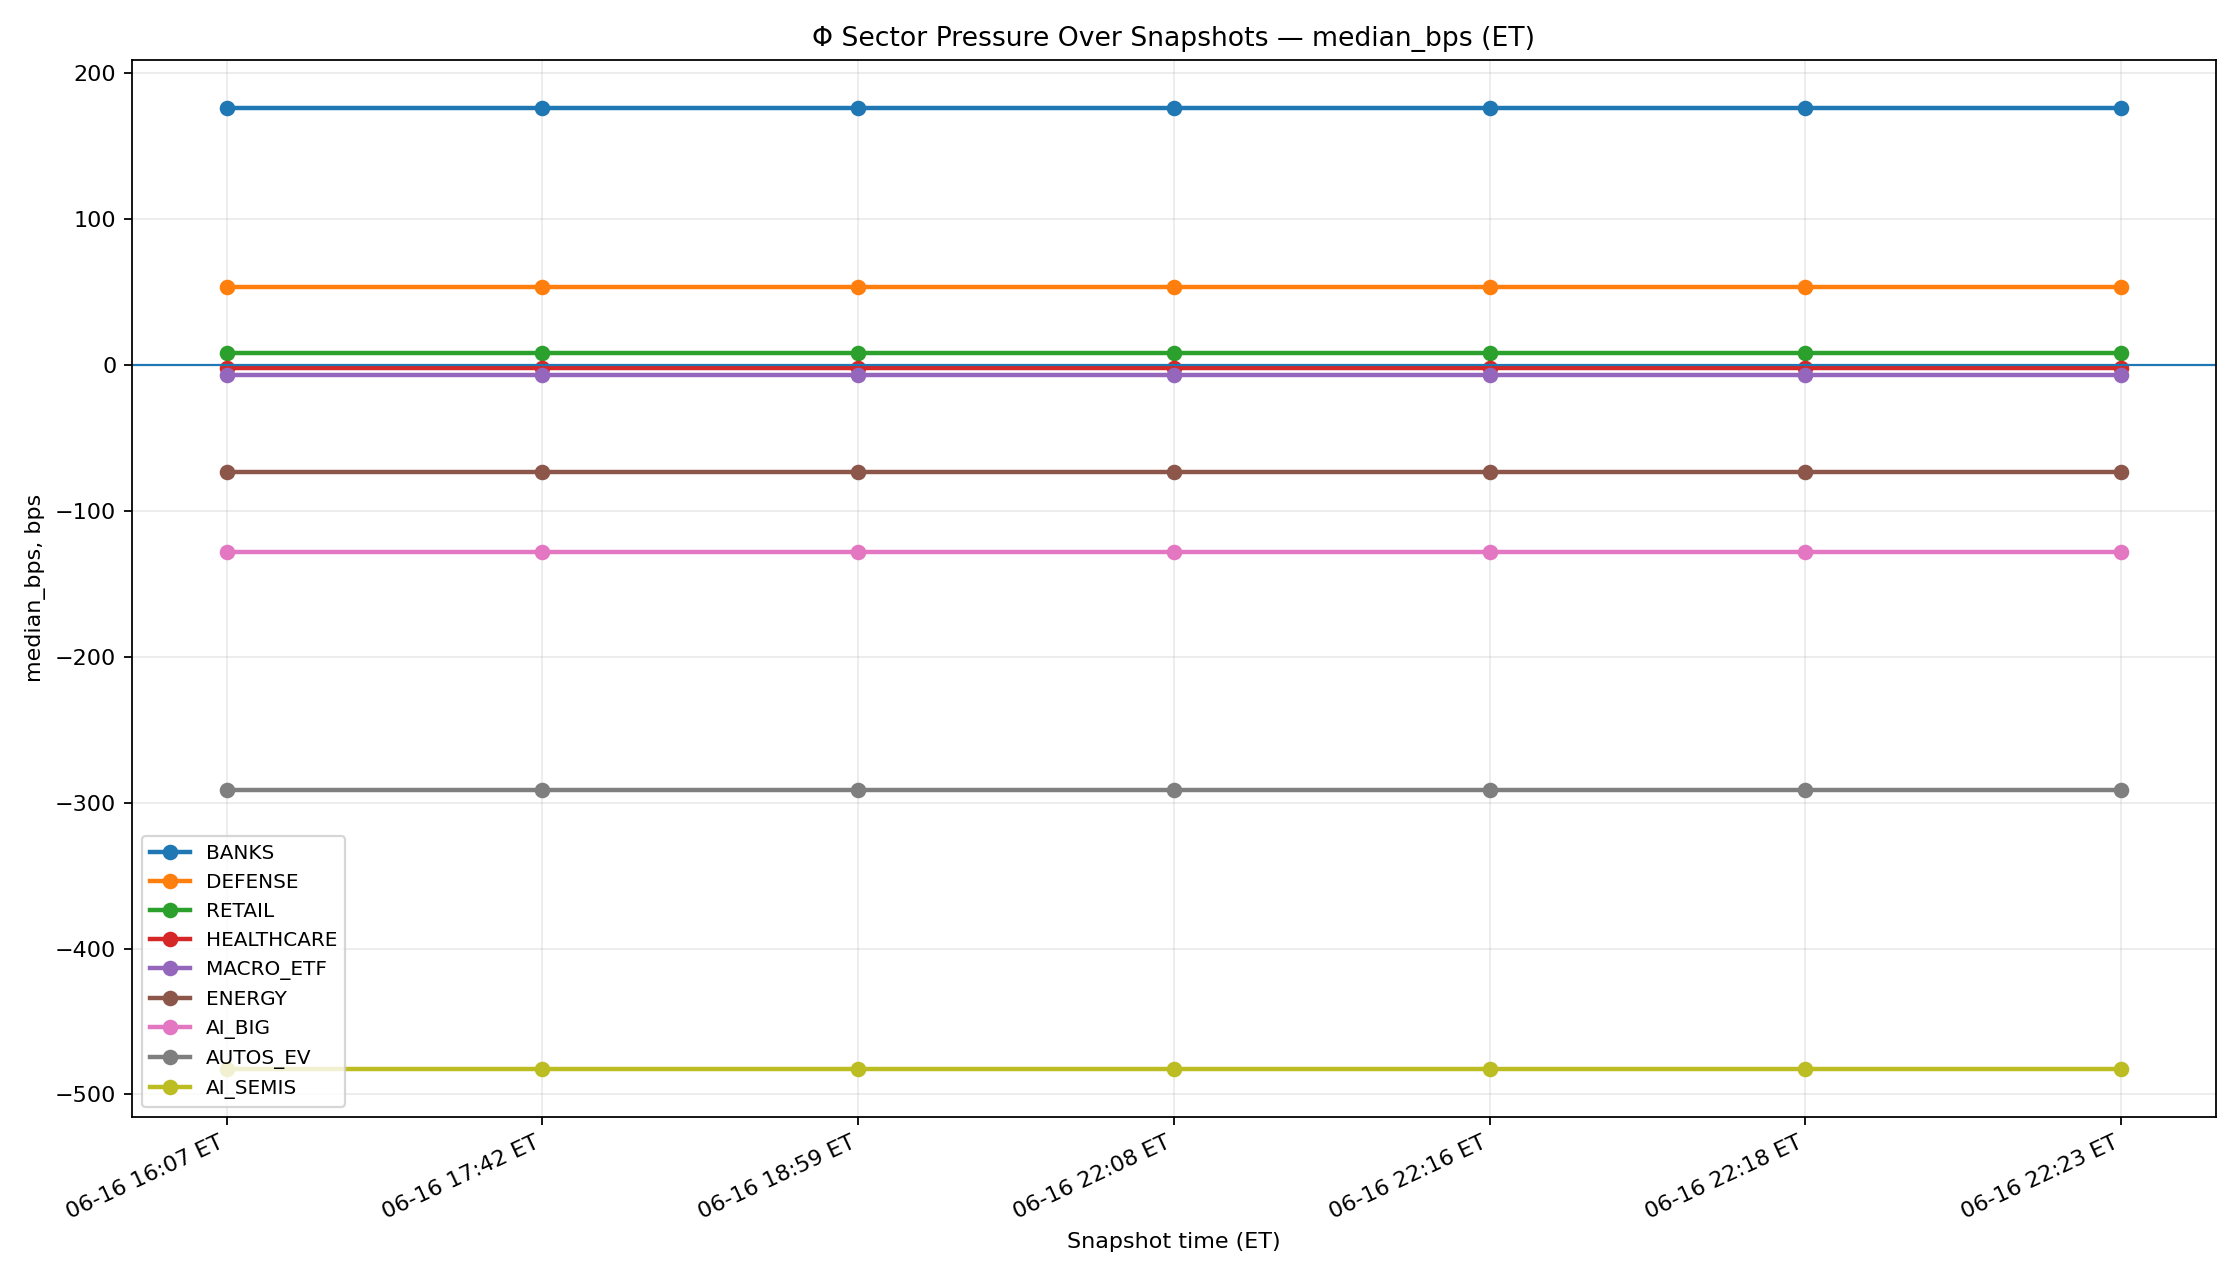
Charts over time
The grid answers where are the sectors now? The chart shows persistence, reversal and spread across the recorded snapshots that led here.
Open charts over time →How to read & use the board
Read. Median bps is the middle sector reading in basis points; 1 bp = 0.01 percentage point. Net breadth is the up-count minus the down-count.
Overnight. When the newest public feed reports a fresh overnight session with usable coverage, the board automatically turns teal and shows those BPS readings. It checks for new data every five minutes and returns to the regular snapshot when the overnight reading is inactive, rejected or more than 20 minutes old. A dash means a reading is missing, not zero.
Explore. Tap a tile, or focus it and press Enter or Space, to open its detail. Hold a tile to unlock the board, then move it to an adjacent square, including diagonals. Hold again to lock. Reset layout restores the original positions.
Names. Parenthetical stock names are illustrative examples, not a list of current constituents. Full glossary →
Compare sectors
Pressure and breadth are ranked by size of movement, not direction.
Data & source details
Coverage and timestamps describe the available feed. The public payload contains sector aggregates, not named constituent assets. Receipts record provenance and integrity, not independent validation of prices.